Personalization reporting – powerful insights to help drive your experimentation efforts
The new Dynamic Yield Dashboard provides marketers with the personalization reporting tools they've been looking for to help optimize every campaign.

Every good marketer understands the value of reporting when it comes to evaluating the success of any initiative. But being able to easily mine key insights for use in optimizing performance isn’t always a cake walk, especially as those efforts scale. We recognize this is what prevents personalization campaigns from reaching their full potential – an obstacle our new dashboards aim to address.
At Dynamic Yield, we take a data-driven approach to everything and truly believe in the importance of experimentation. That’s why, today, we’re excited to share some of the updates we’ve made to our personalization reporting.
In a nutshell, we’ve overhauled how we communicate what’s going on in our platform so you can make all of the solutions and capabilities available work harder for you.
Meet the new Dynamic Yield Dashboard
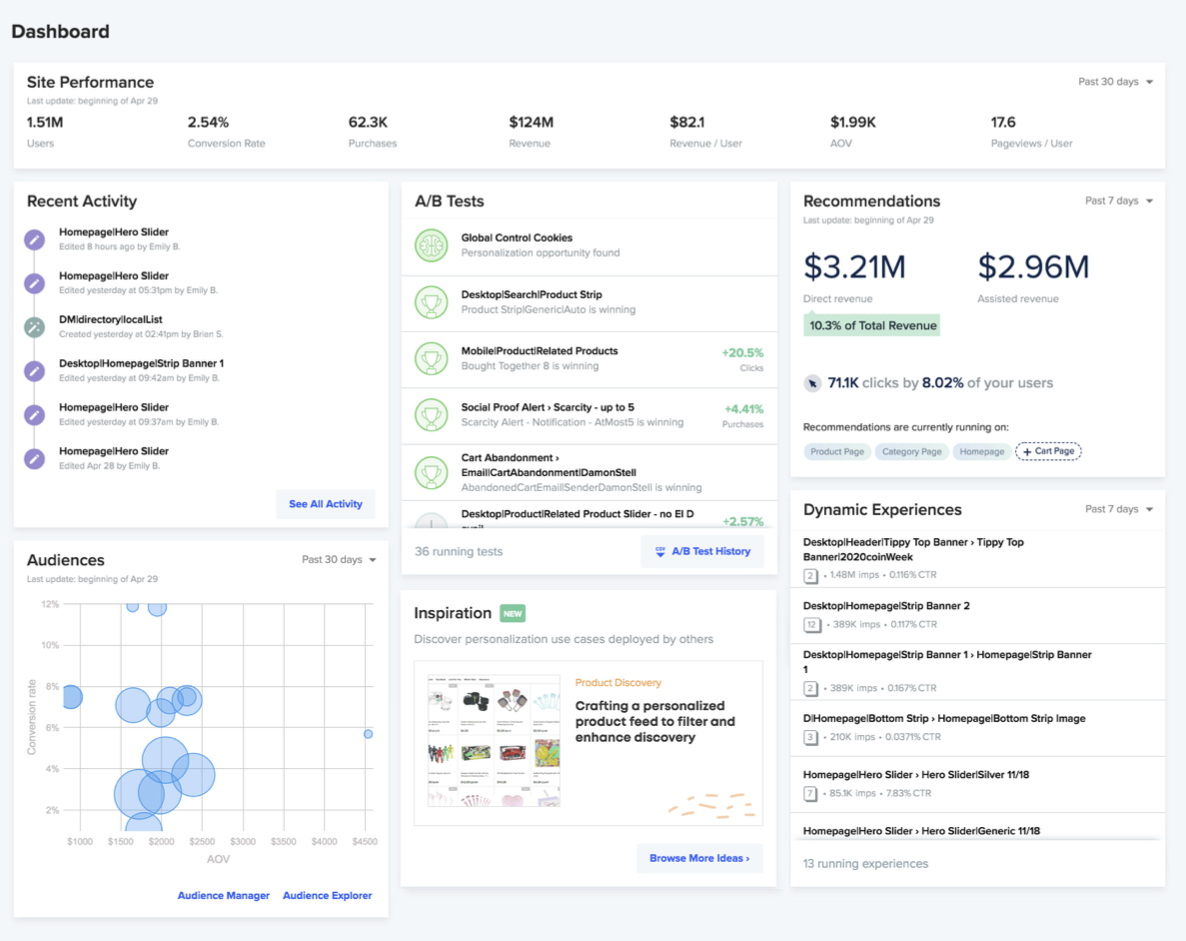
The Dynamic Yield Dashboard gives you a high-level overview of your personalization campaigns, site performance, audiences, product updates, and more. Until now, our dashboard consisted of a variety of different insights that left much to the imagination about how to use them. From here on out, actionability is the name of the game.
“Our customers are turning a one-size-fits-all site into a dynamic one with tens and hundreds of versions based on user behavior and properties. That makes it critical to maintain a bird’s-eye view of all the moving parts – so it will be easy to manage and measure success,” said Gidi Vigo, Director of Product.
With customers building and managing dozens, sometimes even hundreds of concurrent campaigns, our new dashboard provides a snapshot of key information and surfaces items for potential optimization from campaigns that require action. This allows you to streamline workflows, prioritize the most critical campaigns, and save time in managing your personalization campaigns.
All of these new dashboard modules will be gradually rolling out to customer accounts over the next few weeks, so get ready for some exciting changes!
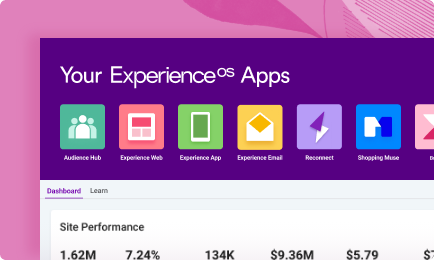
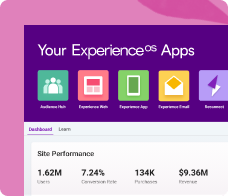
Get a high-level look at your overall performance
Access your most important site metrics
You should always know what’s going on when it comes to critical business metrics. That’s why we’ve highlighted your tried-and-true stats for measuring the pulse of all personalization campaigns running through the Dynamic Yield platform. Depending on your industry vertical, these performance metrics can include:
Users: number of users who viewed at least one page
Conversion Rate: percentage of users that made at least one purchase
Purchases: total number of purchases
Revenue: total amount of all purchases
Revenue / User: total revenue divided by number of users
AOV (average order value): the total revenue divided by the number of purchases
Pageviews: total number of pageviews
Pageviews per User: number of pageviews divided by the number of users
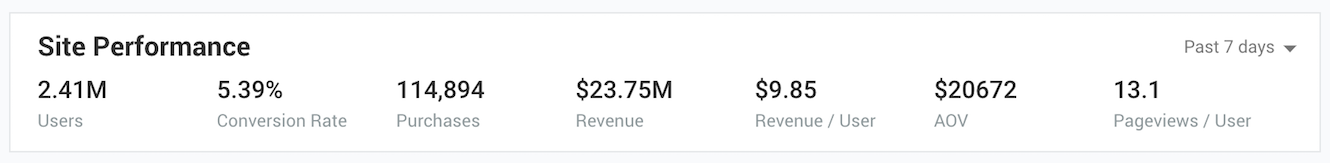
You can also set a time range for your data for up to 30 days from the current date in order to drill down on specific timelines.
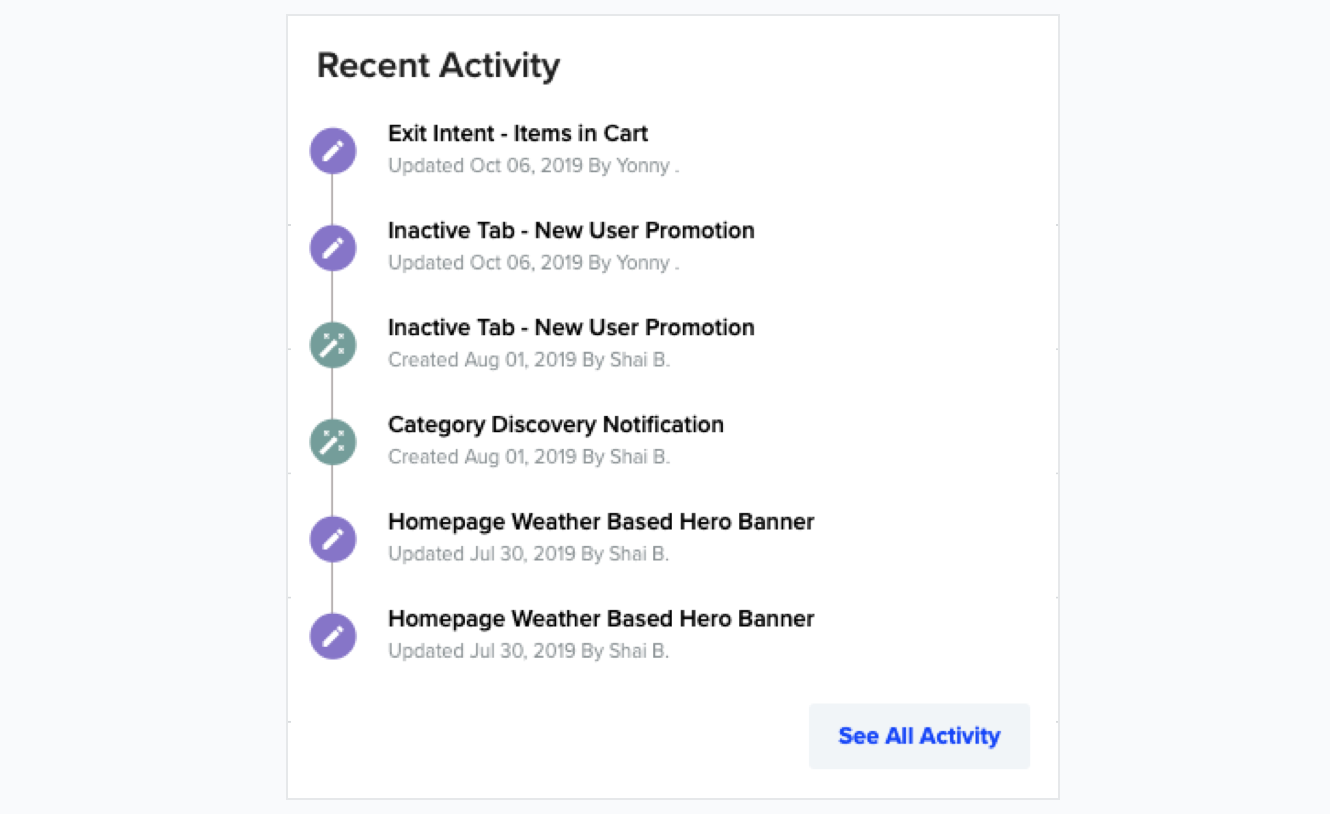
Track all user activity on your account
View the full history of your site personalization campaigns to further see who has changed which campaigns, audiences, and other assets in your account. For ease of navigation, filter the Activity Log by date, users, and campaign-type. For example, if a campaign begins under-performing, or you want to investigate discrepancies between different campaigns you could use this tool to help get a better picture.
In the dashboard, click See All Activity to view the full list, which also includes more information about the types of items.
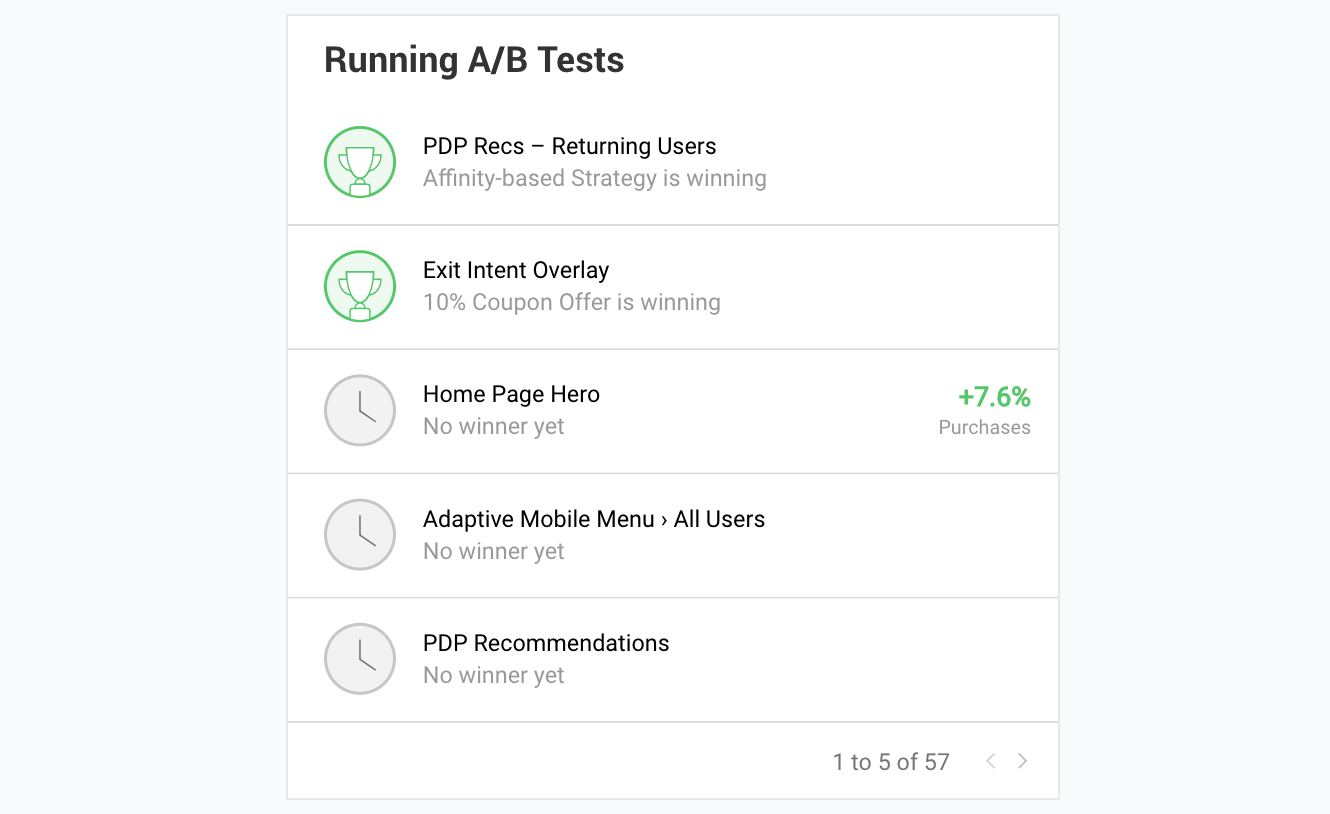
Assess the status of your running A/B tests
Quickly get a handle on which campaigns are still awaiting statistical significance or the winning variations of a particular experiment (with performance metrics) via our new list of all live A/B tests. If a variation is in fact winning, you can choose to pause all of the other variations by clicking through to the campaign right from this screen.
Additionally, if our Predictive Targeting engine has found an opportunity to improve an experiment, you can select to automatically apply it as well. Otherwise, sit back and watch the performance of high-yielding variations for your live campaigns.
Understand how your audiences are impacting business
You can see which audiences and segments are contributing the most to your business along with detailed information about each (available upon scroll). With this new visualization, monitor performance based on conversion rate and the average order value to determine who’s driving impact and who isn’t.
Every blue “bubble” represents the size of a particular audience — view 15 at a time, with top performers positioned in the upper-right portion of the graph ranked by highest conversion rates and spend per purchase.

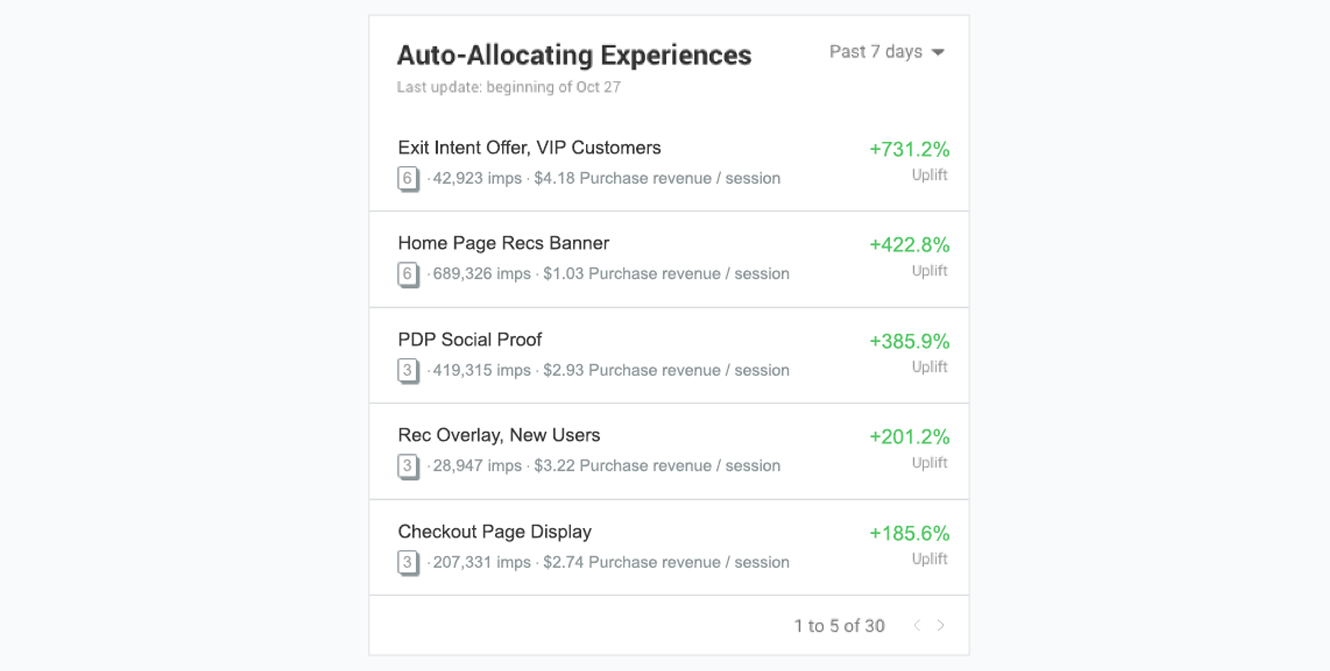
Optimize your automated campaigns more efficiently
View all of your campaigns that are leveraging Dynamic Yield’s auto-allocation capabilities to dynamically shift traffic in real-time towards the best performing variations.
Quickly gauge the performance of your automated campaigns – see how your auto-allocation campaigns are performing against the control group and the impact on your primary metric. Additionally, view information about the campaign – like the campaign name, number of variations, and number of impressions.
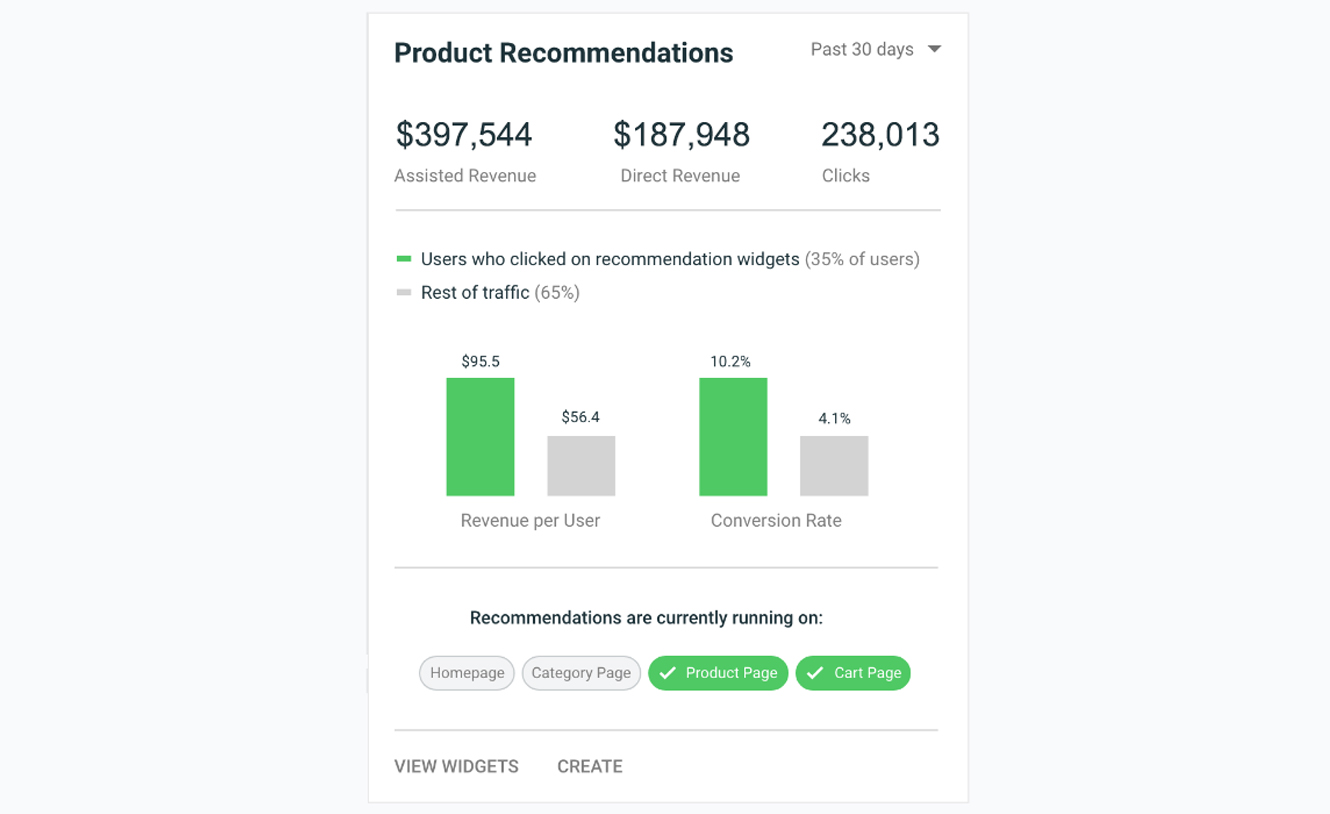
Evaluate how recommendations are driving revenue
Personalized product and content recommendations are a powerful tool for businesses to engage customers and maximize revenue. Now, businesses can quickly and easily see the impact of their recommendation campaigns over a set time period.
eCommerce businesses can view key metrics like the direct revenue, assisted revenue, and total number of clicks for their recommendation campaigns. Additionally, they’ll be able to gauge how clicking on a recommendations widget impacts revenue per user and conversion rate.
Non-eCommerce businesses will be able to view the total number of clicks to track engagement with recommendation widgets and see the page types where recommendation widgets are live.
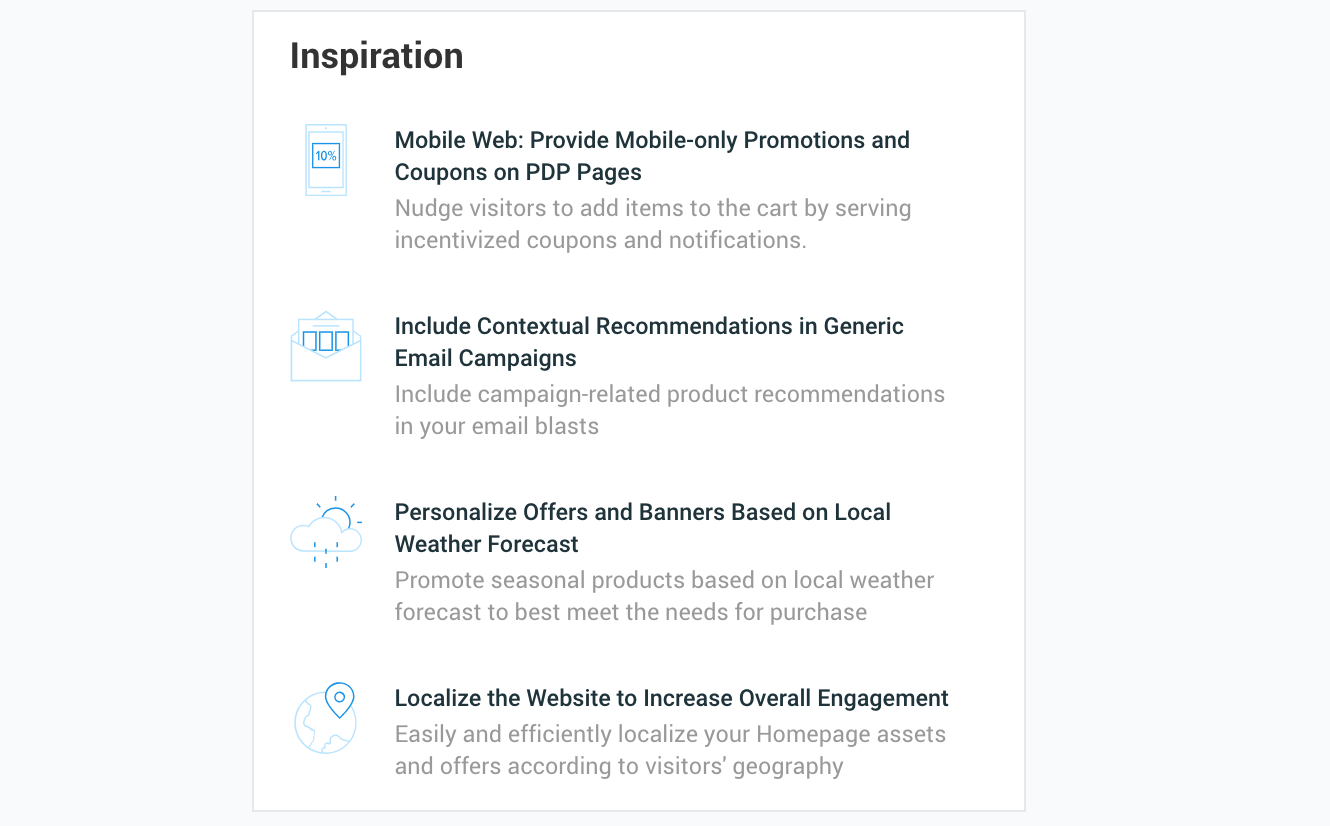
Find inspiration for new campaigns
Need help coming up with new ideas? Now, tap into best-in-class campaign tactics, sourced directly from successful customer case studies you can use as your own personal playbooks.
From help optimizing newsletter signups to personalizing layouts in your mobile apps, cut out valuable time in the ideation process to more quickly launch campaigns and drive results.
This list updates on an ongoing basis to ensure you always have a pool of fresh techniques to employ when you need them.
Building a dashboard that evolves with your needs
These new tools will offer businesses all of the information they need to successfully manage their personalization efforts.
At Dynamic Yield, our team is constantly working to improve the overall experience and usability of our platform. We want to make sure it’s as easy as possible for teams to build, deploy, and manage all of their experiences so they can quickly start seeing impact and results from their campaigns as soon as possible.
If you have any feedback or suggestions on what we’re building and how it can better serve the way you work, we’d love to hear from you. Just reach out to your dedicated CSM, and let’s start a conversation.