Personalization Pulse:
Brands put a lot of energy and thought into implementing different personalization strategies to enhance the digital experience for their customers. And as they look to make the most out of the technology and resources they’ve invested, understanding how well their personalization programs perform is always top of mind.
In working with hundreds of teams from some of the world’s leading companies, Dynamic Yield customers consistently come to us with two questions:
- How do I measure the overall output of my program?
- What is the context of my results and next steps I should take?
Oftentimes, an experience hypothesized to generate meaningful results does not show any uplift – and with no real explanation as to why, teams are unsure of how to optimize its performance.
Dedicated to researching the mechanisms and systems to monitor, measure, and analyze these efforts, the Analyst team at Dynamic Yield found that utilizing the scientific framework of a random, objective Control Group proved the most effective.
A Control Group is defined as the standard to which comparisons are made in an experiment, allowing for accurate measurement of each test or experience on users versus those who are not exposed to it.
Partnering closely with a group of Dynamic Yield super users, we developed a framework for building a Global Control Group, which expands upon the scientific approach above by isolating all experiments or campaigns against a baseline. Then, we aimed to give the results context, ultimately determining that when measured across Impact, Reach, and Contribution, we could provide a very comprehensive picture of a company’s overall program health. And with clear action items to improve it.
We call it Personalization Pulse.
With Personalization Pulse, you can finally understand:
Impact

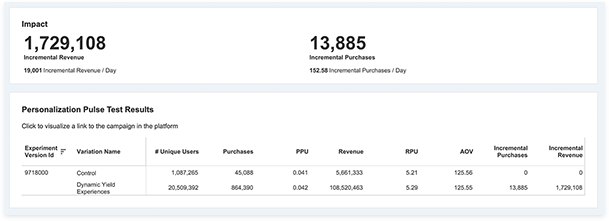
What is it? Quantify the monetary impact of your experimentation program in incremental revenue and purchases.
What can you do with it? Report back to key stakeholders on how much value has been gained to foster excitement and continued support.

Reach

What is it? The percentage of users who were reached by the campaigns measured.
What can you do with it? Increase the portion of traffic to receive personalized experiences or focus on significant groups via high-volume touchpoints.

Contribution

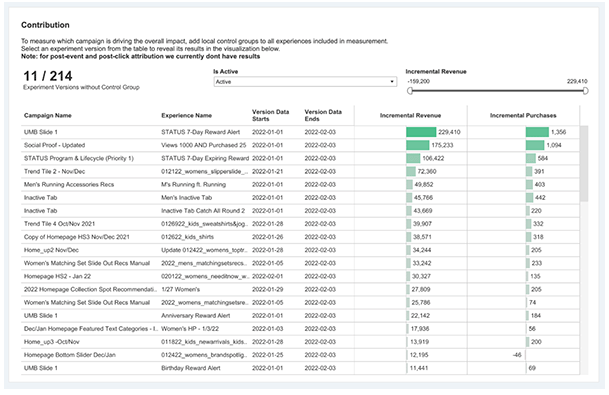
What is it? Determine whether the overall or individual contribution of each campaign was positive or negative.
What can you do with it? Double down on what’s working or stop the campaigns that aren’t yielding results.

