Prioritization Template for Personalization Program Management
We know having a backlog of viable campaign ideas can be stressful. That’s why we decided to create a free, Prioritization Template for personalization program management that marketing teams can use to evaluate and prioritize experimentation ideas their teams develop and start witnessing desired results.

Every personalization marketer is familiar with the following scenario: An overflooded backlog of campaign ideas while short on resources, such as developer hours, to build them. With these constraints at hand, teams need a structured approach to evaluate & prioritize a given set of ideas. Prioritization ensures marketers only execute what matters, weighing the potential additional revenue at stake alongside the number of resources they have available, while also maintaining complete transparency among personalization stakeholders.
In this article, I’ll share a resource that will help teams organize all relevant information about your personalization program so you can prioritize each campaign idea on the basis of four, essential pieces of criteria: contrast, duration, revenue impact, and ease. Designed to guide teams, this resource is completely free and downloadable, and I encourage you to modify it to best suit your needs.
The template is broken down into three parts:
- Campaign Ideas: Description of the campaign idea
- Campaign Prioritization: Campaign evaluation based on four pieces of criteria
- Campaign Results: An executive summary of campaign results and insights
Below, learn about the evaluation criteria listed in the template in order to properly populate and maintain the resource.
Campaign Ideas
The first section of the document is an area where teams can keep track of all personalization ideas they are considering to tackle. It’s a space where all stakeholders can contribute their individual ideas in a central location, providing program owners with a central repository of campaign ideas.

The following is a breakdown of how to populate each column in this section:
Number: Label your campaign ideas with a number, going in chronological order.
Audience: Name of the audience you plan to target, which should match the audience name seen in the admin of your personalization platform (i.e. new users).
Page Type: The page(s) involved in the campaign (i.e. homepage).
Page Element: Section or element of the page the campaign idea is focusing on (i.e. notification banner).
UX Issue: The UX issue that justifies the campaign idea.
Hypothesis: The hypothesis you want to disprove / prove?
Variation: The changes to an experience you are testing.
UI Campaign Name: The name you assign to the campaign within your personalization platform.
Status: Campaign progress tracker (i.e. planning, setup, live, complete, rejected, etc.).
And of course, the information in this scoping section can be adjusted to your needs by adding or removing columns.
Campaign Prioritization
Once you have aggregated a handful of ideas, you can begin the evaluation process. This process will help you map out your testing roadmap based on the priority level. A key element of your personalization program, properly planning out how to execute new campaign ideas is essential to success. It allows you to assess the breadth of your resources – especially when limited – and nail down which ideas to follow up on. The reality is, acting on every test idea is not efficient; therefore, you’ll need to identify the ones that will likely help you achieve your business objectives.
To keep the prioritization process simple, yet effective, we have identified four, key pieces of criteria to evaluate your idea backlog against. And to best suit your needs, we encourage you to add additional criteria, as well as remove or replace the ones listed in our template with ones that best reflect your needs.

Here’s a quick breakdown of the aforementioned criteria.
Contrast: A core, test design principle, contrast assesses whether a campaign will attract the user’s attention and therefore, encourage conversion behavior. In terms of conversion optimization, we like to focus on the contrast between the control and a test variation. Implicitly, this requires asking yourself: “How likely will users perceive the change on the website?”
Duration: An evaluation of the estimated time a campaign needs to run to reach statistical significance. Campaigns that reach statistical significance quickly are often preferable to ones with longer duration as they result in quicker dividends.
Revenue impact: An evaluation of the estimated impact on revenue a campaign will have.
Ease: An evaluation of the number of hours to invest in the campaign. The more hours anticipated, the lower you should score the test for these criteria.
Note: We recommend marking each criteria on a scale of 1-5, where 1=low contrast and 5=high contrast.
Each of these pieces of criteria will result in your priority index, which is the weighted average of the four. You can adjust the weights using the decimals listed below each criterion. The higher the priority index, the sooner you should execute the campaign. Now, let’s take a closer look at campaign duration, impact, and ease.
Campaign Duration
In order to estimate the runtime of a campaign, a few pieces of information are necessary.

Primary metric: The defined metric upon which you declare the winner.
Baseline Performance: Add primary metric performance for the audience and page you are running a test against (after 30 days).
Minimal Detectable Uplift (MDU): An estimate of the effect caused by the test. MDU describes the relative minimum improvement over your control, identified based on a certain degree of statistical evidence. Also known as the cost of conducting the experiment vs. positive conversion performance. Note: The lower the MDU, the more traffic is needed to identify a conversion effect, often resulting in a longer test runtime (and vice versa).
Variations: The sum of the total number of test variations, including the control. Note: the more variations, the longer the test needs to run (and vice versa).
Audience Size (30 days): The sum of the number of users within the targeted audience for the last 30 days. Note: The bigger the available segment size (traffic volume), the shorter the runtime (and vice versa).
Audience size needed: Using a sample size calculator, input the conversions per user goal and the uplift number you’re aiming for in order to discover the minimum audience size per variation needed (calculator included in the second sheet of the template).
Estimated runtime (in days): Number of days the campaign needs to be live before reaching statistical significance*. In order to reduce the runtime, you can, for example, reduce the number of variations in the test or test more contrasting variations leading to a larger MDU.
*Note: Using a statistical significance calculator, you can also calculate an estimate of how long a campaign needs to run (in days) to reach a Probability to Be Best (P2BB) score of 95%.
After assessing all campaign duration criteria, you can now update your priority index.
Impact
In addition to generating valuable user insights, a personalization program should ideally improve business KPIs. Therefore, marketers must also estimate the potential revenue impact each campaign will generate.

Baseline RPU: The current baseline revenue per user for the targeted audiences and campaign pages (e.g. audience explorer)
Baseline Monthly Revenue: The revenue generated for the target audience and page over the past 30 days.
RPU Uplift estimated: The estimated impact on revenue per user or positive uplift generated by the campaign. (Check if you have run a similar test in the past to use as a reference point).
30 days revenue impact: An automated calculation of the monetary impact the campaign will potentially generate in 30 days.
365 days revenue impact: An automated calculation of the monetary impact the campaign will potentially generate in 365 days.
You can now evaluate the potential financial impact the campaign may have and use this number to update your priority index.
Ease
We define ease as the effort (in hours) that a team will need to invest in a campaign. This is broken down into technical and non-technical hours and defined by the appropriate team. For example, the tech team should add the hour estimate for building a template and the marketing team should estimate the effort needed for setup, monitoring, and result reporting.

Once you have an estimate for the time needed to run the campaign, you can use this number to update your priority index. This is the final evaluation needed to identify which campaign to launch next, as well as the overall order in which to execute your backlog of campaign ideas.
Campaign Results
In order to keep track of the results generated by your personalization program, we’ve also included a section in the template where you can track your campaign results. By stating the actual results alongside the prioritization criteria, we can compare our initial uplift estimates with the actual numbers. Not only will this help improve upcoming prioritization rounds, but by extracting users and other insights from the campaign analysis, you will also be able to use it as a reference point for follow-up campaigns.
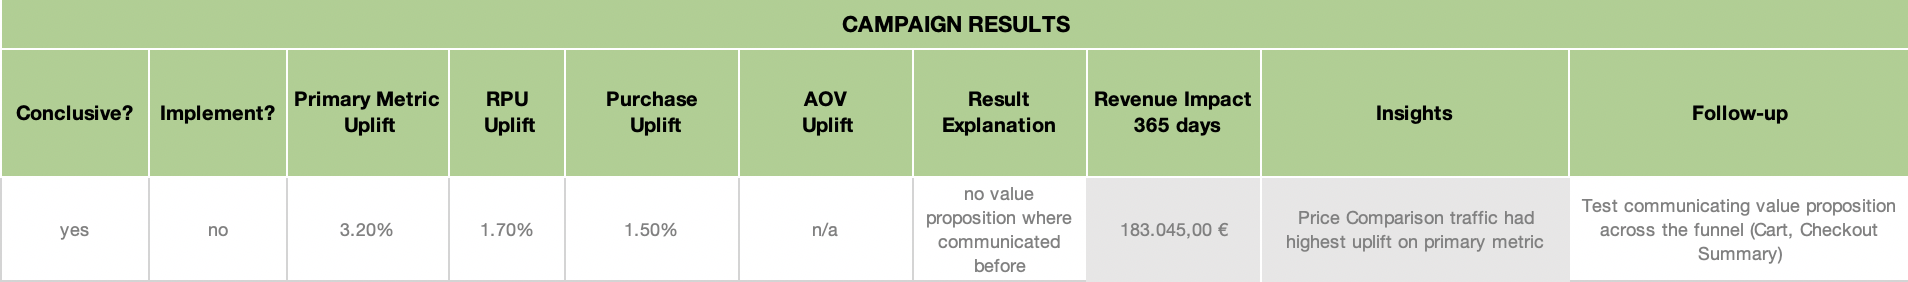
Conclusive: State “yes” if the test has reached significance and “no” if not.
Implement: State if the winner will be hard-coded in the back-end, served via your personalization platform, or if no action will be taken / implementation will be conducted upon the result.
Primary Metric Uplift: Input the uplift witness against the primary metric after the campaign runs its course.
RPU Uplift: Input the actual RPU uplift witness after the campaign’s conclusion.
Purchase Uplift: Input the actual purchase uplift number after the campaign’s conclusion.
AOV Uplift: Input the actual average order value (AOV) uplift from the campaign.
Result Explanation: Write an explanation of the observed results. This does not have to be definite but should include a possible explanation. This is especially important when you need to disprove your initial hypothesis. Note: the result explanation is also a hypothesis on its own
Revenue impact during test duration: Calculate the difference in revenue between the winning test variation and control over the course of 365 days. See “Revenue Impact Analysis” sheet in the template.
Insights: Your analysis of the campaign results will very likely result in valuable insights about your users, especially if you conduct an audience-based analysis. Collect this information in this column to reference at a later point (and use this inf to outline future actions to take).
Follow up: With the insights from above, you’ll probably already have an idea in mind on how to extend positive performance from a campaign (or how to improve the less-desirable results you witnessed). Therefore, use this column to aggregate follow-up ideas that can be added to the backlog of future campaign ideas.
When you organize your campaign ideas, identifying how to best prioritize tests becomes a far less daunting task. I hope you find the resource to be useful for your personalization program and that it helps inform your long-term testing roadmap.
 Why Gen Z Craves Personalized Restaurant Experiences