Outliers detection – ridding the extreme events threatening your A/B tests
Huge deviations in site behavior may be leading to unintended consequences in your A/B testing campaigns. Here's how to reconcile them.

![]() Summarize this articleHere’s what you need to know:
Summarize this articleHere’s what you need to know:
- Outliers, like a single unusually large purchase, can skew A/B test results and lead to wrong decisions about the winning variation.
- P2BB metric, considering the likelihood of sustained outperformance, helps determine the true winner of an A/B test.
- Standard deviation can be used to identify outliers that fall outside a certain acceptable range.
- A/B testing platforms should have outlier detection mechanisms, like the 68-95-99.7 rule, to ensure reliable results.
- Outlier detection safeguards A/B testing from being misled by random fluctuations or data errors, enabling confident decision-making.
When running an A/B test, one of the most important questions we seek to answer is which variation is performing better – not just during the test, but in the long run. This is why we tend to follow the metric Probability to Be Best (P2BB). Unlike more “naive” calculations such as uplift, which simply compare differences between the results of each variation, P2BB attempts to ascertain the likelihood a leading variation will continue to outperform over an extended period of time. It takes the collected data of each variation and runs advanced calculations to generate a score. In practice, this score is used to declare winners and losers, typically acting as the ultimate decision-maker for whether to stop a test and apply a winning variation or wait for more data.
But what would happen if one day, a huge deviation in visitor behavior were to contribute to a variation’s success, like a random user making a one-of-a-kind purchase? Based on what we know about P2BB, it’s safe to say this type of activity might lead to a false score, leveraging data that does not reflect normal site behavior to predict the future outcomes of an experiment.
Therefore, those tasked with optimizing experiences must be sure to account for and properly handle these extreme events within their campaigns. As not doing so will negatively skew results and tip the scales in favor of variations that may not, in fact, shape up to be the best in the end.
A decision you don’t want resting on your shoulders.
What are outliers?
In the field of statistics, an observation refers to the value of a variable one is interested in measuring during an experiment or test. There can be various sets of observations, each assigned its own value for the purposes of data collection.
An outlier is an observation point distant from other observations.
For example, the average height of men in the U.S. is 5’9.5” (1.77m), but LeBron James, an NBA player whose height is 6’8” (2.03m), is an outlier. And in the context of eCommerce, an outlier can be the value of a single purchase.
Below, let’s measure a sample of different purchases reflecting various revenue values at a particular point in time.
 |
From the graph, most purchase values outlined are concentrated around the $50-100 range, with several purchases coming in closer to $1,000. Albeit very few of them, they should be considered outliers, as they can influence conclusions and courses of action for the specific A/B test at hand.
Let’s take a look at how a pesky outlier might make its way into your test results.
The following depicts an experiment unaffected by outliers, where “Variation A” is the clear winner after having served the test to 2,000 users.
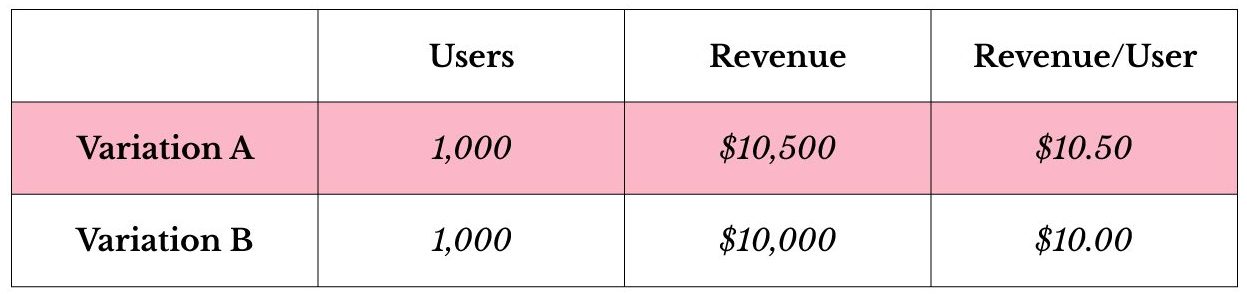
However, should an outlier present itself, the metrics might look quite different. Here, an individual has suddenly purchased 200 shirts at $100 a piece and has randomly been served “Variation B.”

Upon looking at the raw data, one person with a single purchase completely shifted the results of a test served to 2,000 users. It is extremely unlikely that tests this individual may have been exposed to (e.g. button color, recommendation strategy) during the session in question had any effect on their decision to spend $20,000 on a bulk order of shirts at one time. Linking this purchase to the campaign would, therefore, lead to the assumption that one losing variation was actually the winner. Which is why when analyzing A/B tests, identifying outliers events is so critical to generating reliable results.
How to filter outliers out?
First, the average value in question must be distinguished. From there, what’s called a standard deviation can be calculated – this number represents the extent of variance or amount of dispersion between the data points and statistical average. Based on the distribution of all events being measured in the general population, values crossing a certain threshold range (above and below) are defined as outliers.
 |
For instance, a retailer may yield 2,000 purchases per month, distributed in a manner that marks below $10 and above $500 as outliers. They will then use this threshold in all future tests to filter out single events that may negatively skew results.
However, not all thresholds are created equal, so these values should be carefully considered before launching every A/B testing campaign. Using the same threshold for an audience of “Big Spenders” vs “Bargain Hunters” would likely produce inaccurate results. Alternatively, a test for mobile vs desktop users can also suffer from a similar impact of outliers, since these groups traditionally experience different average order value (AOV).
How should A/B testing platforms handle outliers
The algorithm some A/B testing software uses to detect outliers is based on the 68–95–99.7 rule, an industry-standard, whereby 99.7% of the sample population being studied are within three standard deviations. (P.S. This is the algorithm that we use in Dynamic Yield) Meaning if we collect outlier events, such as purchases, and their value is three times the standard deviation from the average, they are marked as outliers and treated accordingly.
Outliers thresholds are calculated per event (e.g. purchase, booking, etc.) and for each test, accounting for experiments with both high and low thresholds, like in the case of the “Big Spenders” vs “Bargain Hunters.”

Some platforms (like Dynamic Yield) also provide the option to choose whether to include the outlier and outlying area events within the reports, or exclude them altogether. Additionally, winning calculations will be based on filtered outlier events and affect revenue-based metrics.
Purge before your splurge
By ingesting data which include outliers, companies end up feeding the personalization platform employed to calculate important metric events with information unrelated to the variation and not a great predictor of the future. Variations initially thought winners will likely end up with lower AOV in the long run, since outliers purchases are unlikely to happen – wasting valuable time in the experimentation process, resulting in the loss of higher-yielding revenue opportunities, and sacrificing a better overall customer experience.
With outliers detection, you can measure the impact of your efforts in the most reliable way possible.