The role of optimization analytics in experimentation
From ideation to execution and analysis, data and analytics can support marketers at every turn, turning any business into an insights-driven industry leader.

![]() Summarize this articleHere’s what you need to know:
Summarize this articleHere’s what you need to know:
- Experimentation analytics are crucial for turning data into actionable insights, driving business growth, and improving user experience.
- The 3 stages of experimentation – ideation, execution, and analysis – all rely on data and analytics to inform decision-making.
- Asking the right questions is key to gathering useful data. Consider user perspectives and segment data for deeper understanding.
- Track relevant events and engagement metrics to measure the impact of your experiments and avoid misinterpreting results.
- Challenge your assumptions! Use secondary metrics to uncover hidden insights and learn from both positive and negative results.
Today, it’s not enough to be versed in analytics. You need to understand how to use analytics to solve the specific business problems you own. Those of us in the digital world may all be using the same tools—Google Analytics, or Adobe, or any other stack—but we’re using them in very specific ways for very different purposes. The nuances are critical.
SEO teams are likely hyper-focused on keywords and bounce rates, while advertising teams are looking at impressions, costs, and click-through-rates. Content teams pay attention to session metrics and pageviews, and the web development team is keeping its eye on page speed and performance.
These teams are pulling different insights out of the same collection of data, creating fractured subcultures of data analysis, and experimentation teams are not exempt. If you are leading experimentation on your organization’s site or in your product, you need to adopt a particular lens for data analysis to answer the types of questions that an experimentation role will ask of you.
In this post, I’m going to walk you through the three stages of experimentation from ideation through execution and into analysis, and highlight how analytics and data can support your experience optimization process at every turn.
This includes:
- How to use analytics data to generate and validate an evidence-backed hypothesis,
- How to measure experiments to get insights in addition to wins and losses, and
- Ultimately, how to push your experimentation program forward.
Note: The term “Optimization Analytics” is fairly broad. Both qualitative and quantitative analysis are necessary in your optimization work, however, while digital analytics is only one component of a well-rounded optimization process, I’m going to focus here for the bulk of this post.
Experiment ideation
First things first, let’s level set on what an analytics platform really is and what it’s capable of. To a lot of people, their analytics platform is a golden goose—a treasure trove of data that holds the secret to more traffic, more revenue, and more success.
In reality, your analytics platform is like the magic 8-ball toy you had as a kid. It won’t do anything valuable or interesting until you ask it a meaningful question. If you wander aimlessly through analytics looking for an insight, you’ll likely end up exhausted and discouraged.
Instead, take a step back and consider the problems you are trying to solve. You may have a hunch, or a list of questions or ideas about your site, product, or users. Once you have those questions, use your analytics platform to either confirm or reject your hunch.
If the data backs up your initial hunch, this may indicate a meaningful insight and an impactful test idea. If it doesn’t, you may have uncovered something new to dig into, or you may have successfully closed the book on a dead-end idea.
If you find this part challenging, you’re not alone. It’s the reason companies like Google have rolled out the Insights portion of Google Analytics—to try to jumpstart the actual insights flowing out of the data. While still fairly rudimentary, these artificial intelligence-driven insights are a step in the right direction in prompting us to ask the right questions of our data.
My tips for asking the right questions are to:
- Put yourself in your users’ shoes,
- Track events, and
- Segment segment segment
Put yourself in your users’ shoes
One of the best ways to identify a strong experiment idea is to put yourself in your users’ shoes, especially if you are new to your role or business (you’ll have a fresh perspective). Browse your website or app as if you’re a new user and look for points of friction or opportunity.
Perhaps you’re at an eCommerce company and you find that shipping costs aren’t available on your cart page; that may be a potential point of frustration for users. Now, you have a good set of questions to ask of your analytics platform:
- How many users pogo-stick between your cart and the point of your checkout that contains the shipping information?
- How many people exit from there?
- How many convert?
You’re on your way to identifying a new test idea.
An Example
One of our clients is an apartment rental company. Their site allows people to browse apartment buildings in their area and find units for rent. If someone finds an apartment they like, they simply click the “Phone” or “Send Message” buttons to contact the property to set up a viewing or start an application. This lead is the primary metric we are optimizing.
Our first step when partnering with this company was to browse their site and put ourselves in their users’ shoes. This surfaced a hunch: Certain tabs at the top of the apartment building pages contained valuable content that we felt was more likely to induce a conversion than others.

This gave us a question to ask of analytics: Do visitors who have visited certain tabs convert at a higher rate than others? We used Google Analytics data to confirm our hunch and, sure enough, the “Reviews” tab was the most likely to result in a lead from a visitor. (Note: The photos tab is open by default on page load.)
Our hypothesis was simple: Ordering the tabs from left to right in order of likelihood to result in a conversion will result in higher performing tabs receiving more traffic, ultimately increasing conversions. The result? A +4.93% increase in leads.

Track relevant events in your analytics platform
If you’ve been testing for a while, this one may seem like a no-brainer. But I am constantly surprised at how many organizations still under-leverage event-tracking. If you’re building an experimentation program from the ground up, or if you have a redesign or new rollout coming up soon, take some time to map out the important actions and events you may want to track across your site.
Build a framework to organize and tag these events using Google Tag Manager or Dynamic Tag Manager for ease of execution. Engagement with your navigation or footer, clicks to calls-to-action, scroll depths, video plays, etc. are valuable actions that may help you uncover key insights based on these user behaviors.
You may be thinking, “that’s what heatmaps are for.” Heatmaps will show you what users are clicking on, but they won’t enable you to segment based on those actions and cross-reference conversion rate.
Imagine you have a product page featuring a video. A heatmap shows you that many of your users are clicking the video. In fact, it’s one of highest engaged elements on your page. The logical next step is to put more videos on your site, right?
Hold on. There’s an assumption built into that conclusion: That video views are correlated to conversions. If you are tracking video engagement in your analytics platform, you can segment users who watched the video and those who didn’t and see who actually converted. You may find, to your surprise, that those that don’t watch the video are more likely to convert. In this case, you have a counter-intuitive test idea; remove the video and see what happens to your conversion rate.
You may find event tracking somewhat daunting from a time and resource perspective. If that’s the case, you should consider tools like Heap or the auto-event tracking capabilities of Google Tag Manager to automate some of the work and enable event data collection automatically.
Segment segment segment
If they aren’t already, segments should be your best friend. Canned reports in analytics platforms will only tell you so much. Segments can unlock a whole new realm of untapped insights and custom segments are often a faster route to answering a question and providing the most granularity.
One of the most valuable ways you can use segments is to gain a better understanding of the actual users visiting pages on your site.
Analytics platforms often interchangeably report on sessions, pageviews, unique pageviews, users, etc. in pre-built reports—all of which have different definitions. Many A/B testing tools, however, operate on a “unique visitor” level. Building segments based on users will enable you to more accurately estimate things like audience size, conversion rate, and test duration using historical data from your analytics platform.
The ultimate step-by-step guide for creating and targeting micro-segments to reach your most valuable users today
An Example
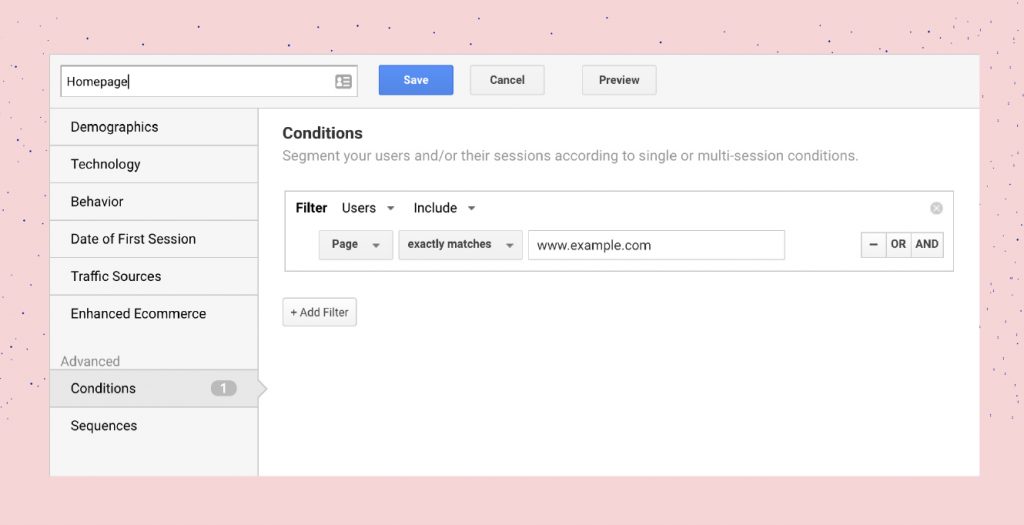
To do this in Google Analytics, for example, build a custom segment that utilizes the “conditions” section of the “advanced options” tab and set the condition to filter users (not sessions) that have visited a specific page—say your homepage.
You can then apply that segment to any other report to analyze the behavior of users that have interacted with the homepage at some point in their journey. Adding this segment to the audience view will show you your expected audience size. Adding it to your conversion views will show you how many conversions you can expect for an experiment targeting the homepage.
Another very helpful component is the sequences tab, which can enable you to build segments of users that follow a specific path and compare that journey to estimate audience size or conversion rate, etc. The custom segment feature is a treasure when it comes to detailed analysis.
Experiment execution
Using analytics to identify an experiment idea is only half the battle. Knowing what to track and how to measure the performance of that idea-turned-hypothesis is critical. To evaluate success and to gather insights and learning along the way, you need to ensure you’re tracking the right metrics.
There’s a lot of information out there on this topic, and I’m going to break from the herd on a few best practices. But the ultimate takeaway is this: Your experiments are only as good as the metrics you are tracking, and the thought you put into these metrics.
Define your metrics up front
In an experiment, you are likely tracking both primary metrics and secondary metrics.
Primary metrics should be consistent across many if not all of your experiments. If yours is an eCommerce company, your primary metric might be “Revenue per Visitor (RPV)” or “Transactions.” If your company is powered by leads, it may be “Leads” or “Sales Qualified Leads;” in SaaS, it may be “Product Trials.”
Your primary metric should be closely tied to your business’ bottom line and it should be very difficult to game. That is, you shouldn’t be able to easily influence your primary metric with a simple button color test.
Secondary metrics are often more experiment-specific and will change depending on what you’re testing. You may utilize a few guardrail metrics—like “Visits” or interactions with each step of your funnel—to suss out any noise in your primary metric. You may also track engagement metrics like clicks to a CTA, or visits to a specific page likely to be impacted by the changes you’re making.
Secondary metrics exist as both a sanity check on your primary metric and a learning or storytelling opportunity when your experiment concludes.
Track more secondary metrics than you think you should
Your primary metric is your guiding light for go/no-go roll-out decisions, but it can’t tell the entire story on its own. You need secondary metrics to help explain why your primary metric went up or down.
This is especially important when an experiment has a negative impact on your primary metric. It’s never easy to present negative numbers to your boss, but it becomes a lot easier if you have supporting metrics that tell the story of why and what next.
Secondary metrics can often point to how to turn the observed negative impact into a follow-up experiment because they paint a clearer picture of why users behaved the way they did.
An Experiment Example
Another partner of ours is an eCommerce company. One of their landing pages was a very high-performer; we wanted to test the same experience on the homepage to see if we could replicate this success. The variation featured a hero section that matched the look and feel of that successful landing page. This change, however, resulted in a -10.6% decrease in transactions.
If we had only been tracking a single primary metric, in this case, transactions, we would have closed this experiment as a “loser” and moved on to another idea without understanding why transactions decreased. Luckily, we were tracking secondary metrics.
Among the secondary metrics being tracked were clicks to a “How it Works” video embedded in both the control and the variation. As it turned out, clicks to that link went up +153.6% in the variation! A surprising result and one that got our attention: What if video content wasn’t as helpful as we thought? What if it was actually distracting users and hurting conversion rate on the site? We set out to answer that very question with a follow-up experiment on the company’s product pages.
These pages featured a prominent video link in the hero, similar to what we had tested on the homepage. We hypothesized that by reducing its prominence, and therefore user engagement with the video, and replacing that visual real estate with a static value proposition, we could lift conversion rate on these pages. Sure enough, the experience with the less prominent video resulted in a -29.4% decrease in video views, and a 33% increase in transactions.
A note.
The prevailing wisdom in experimentation and statistics is that the more metrics you track, the less reliable your results are, primarily due to the multiple comparison problem.
The reality is that, while this is true in conventional statistics, most experimentation platforms have adapted their statistical models to control for this. This means that your primary metric is considered in a near vacuum and will not be impacted by additional metrics you’re tracking for insight and learning purposes.
I also want to point out that, in most cases, our experiments are not a life or death situation. The statistics developed to support A/B testing have a deep-rooted history in clinical trials where stakes are very high and the margin of error has to be razor thin.
Unless you’re experimenting on something like a radical change to your core business strategy or pricing model, it’s unlikely that your changes require this level of mathematical scrutiny. The benefit of learning from the movement in your additional metrics likely outweighs any negative impact they may have to the reliability of your final outcome.
Integrate your testing tool with your analytics tool
As much as I’ve talked about making sure you define the right metrics up front, the reality is that you won’t always get that right.
Often times, our assumptions about how users will interact with an experience are wildly different from reality. Sometimes, you’ll see extreme swings in one direction or the other that are far off from your expected result and none of your secondary or “guard rail” metrics illuminate the “why.”
This is why integrating your experimentation platform with your analytics platform is so important. And if you follow my earlier advice and set up your event tracking first, you’ll be in a better position to turn a confusing result into an insight.
For example, you may find that a change in your experiment caused traffic to surge to an unexpected page that you didn’t think to track ahead of time. When your testing platform is integrated with your analytics platform, you’ll be able to utilize all the data already being collected and compare it across your variations to explain these unexpected results.
Analytics and Experiment Analysis
Results analysis is an essential piece of a sustainable experimentation program. Again, analytics allow you to evaluate the success of the experiment given your goals. You should be able to demonstrate the impact of your efforts and uncover new insights to generate a continuous stream of experiment ideas.
Determining Success
Of course, you need to determine whether your experiments perform better (or worse) than baseline. How you do that will depend heavily on your specific environment and the metrics you identified pre-experiment.
In a perfect world, if you saw your primary metric go up, you’d roll out the variation as the new experience; and if you saw it go down, you’d stick with the control. We don’t have the luxury of a perfect world, that’s why we’re optimizing!
In the real world—especially if yours is a larger organization or a longer conversion funnel—it can be difficult to achieve material, measurable impact on your primary metric at every stage of the funnel.
It’s not uncommon to find yourself in a situation where your primary metric looks flat, but you see good movement around your secondary metrics. In some of these cases, you may want to move forward with the variation for reasons beyond solely a lift in your primary metric. Experiments that are neutral (even losers) can still be winners.
For example, imagine you’re at an eCommerce company and you just ran an experiment on the homepage introducing a new featured products section. You find that transactions are flat at the end of the experiment, but engagement with the featured products is high and traffic to these specific product pages is improving as well.
You have succeeded in introducing a new promotional area on the homepage that doesn’t hurt transactions and creates an opportunity to feature products that may be high value to the business for other reasons. You also have a new promotional vehicle to experiment with. Perhaps other iterations of this area will lift conversion rates with the right featured products or messaging.
Demonstrating Impact
Projecting the impact of your experiments is key to getting and maintaining stakeholder buy-in, proving the value of your program, and ensuring your initiatives retain the budget they deserve.
You’re likely responsible for certain KPIs. You need to show that your experiments are having an impact on those KPIs and on your business’ bottom line. The goal of projecting the impact of your experiments is to prove the Return on Investment (ROI) of your initiatives and experiments, as well as demonstrating longer-term value and impact.
The common approach to these projections is to take the observed lift of your experiment and project that lift out over a period, commonly 12 months, to show how much additional revenue or how many additional conversions, leads, or transactions your experiment could potentially produce if it were to become the new baseline on the day the experiment was stopped.
Let’s explore a simple example to clarify that concept. Let’s say you run an experiment with one variation and a control for four weeks. Your variation results in a 5% lift in transactions at 95% confidence. Awesome! But now you need to show what that observed 5% lift means to the business in a more material way.
Over those four weeks, you received 200,000 total visitors to your experiment: 100,000 in the control and 100,000 in the variation. 9,500 people converted in the control, and 10,000 people converted in your variation (your 5% lift). You can take two approaches to project the impact of this experiment:
- Use the experiment data alone, or
- Use experiment data combined with historical data
In the first method, you are basing your projection solely on the data observed during the experiment. You aren’t considering any long-term seasonality or potential external factors outside of the experiment’s duration.
Using this method, you would project the traffic volume observed during your experiment over a full 52 weeks:

Then, you would calculate the difference between the Control conversion rate and the Variant conversion rate on those annual visitors:

That 13,000 is the projected estimated additional conversions you can expect based on the observed 5% lift during the experiment.
If you know your average order value is, say, $100, then you can take this one step further to calculate estimated additional annual revenue:

Using historical data is another approach, which may be more accurate for your business if you have significant seasonality that the experiment didn’t observe. In this approach, you would pull the previous 12 months of traffic and conversions to the page or pages your experiment targeted, and use those numbers in the same “observed lift” calculations above.
Instead of 2,600,000 annual users and 247,000 conversions, you may find that the page actually had 3,200,000 visitors over the last 12 months, and 270,000 conversions due to some higher traffic periods that weren’t accounted for during the experiment.
None of these calculations are perfect, which is why it’s important to label them as projections and estimations, but they’ll help you show a more tangible result from your work in numbers that may appeal more to those higher up in the organization.
Uncovering New Insights
In the end, uncovering new insights is what it’s all about. Of course, a primary goal of marketing experimentation is to improve revenue and lift conversion rates, but insights are the key to true, long-term success.
“Insights-driven businesses bring insight, not just data, into every decision, and they know exactly how to use them for greatest advantage across the entire customer life cycle. For these firms, digital insights and what they do with them are their secret weapons to disrupt your market and steal your customers.”
— Brian Hopkins, Ted Schadler, and James McCormick, Authors of Forrester’s report, The Insights-Driven Business
The tactics and suggestions outlined above will help you lay a foundation to start uncovering these insights, but it’s important to remember that your tools can’t do this for you. You will only uncover core insights if you put the effort into asking the right questions and collecting the right data to answer those questions.
If you do step into the realm of optimization analytics, you can join the ranks of insights-driven businesses that are at the forefront of their industries or disrupting others.